Concurrent Marking in G1
The recent change JDK-8210708 fundamentally changed how G1 uses mark bitmaps to store liveness information: instead of recording this information using two bitmaps spanning the heap that G1 uses alternatingly, there is now only one bitmap. This not only changes how G1 uses the bitmap in many places in the garbage collector, but also reduces G1 garbage collector native memory consumption by a large amount, to be exact by 1.5% of Java heap size. I thought this would be a great time to explain how the current concurrent marking cycle works and how G1 uses the bitmap in detail.
As a side effect, this change also obsoleted one more significant part of the original G1 paper.
This is a fairly technical post, so feel free to skip to the end for the impact discussion. :)
Introduction and Background
After determining there is need for collecting garbage in the old generation, G1 first determines which objects are live in the old generation by tracing through the object graph concurrently, followed by incrementally reclaiming garbage and compacting the Java heap in subsequent garbage collection pauses. G1 stores the liveness information in a bitmap external to the Java heap.
Section 2.5 of the G1 paper describes the data structures and how marking worked before this change. Here I will first recap the commonalities of these two implementations, while detailing the current process in full in the next section. Please refer to the paper for the old implementation.
Concurrent marking in G1 uses a snapshot-at-the-beginning(SATB) algorithm - i.e. keep objects that were live at the start of marking live. G1 takes a virtual snapshot of the old generation heap contents at that time. Only the heap contents live at the start of that mark will be marked through, everything allocated after that event will be implicitly considered live and not traced through. This has the advantage of the amount of objects to be examined for liveness analysis is fixed, while at the same time objects that may have become dead after that snapshot will not be reclaimed. Reclaiming this new garbage needs another concurrent marking cycle.
Having fixed data to work on provides simple guaranteed termination properties. The design of G1 considers this more important than earlier reclamation of objects that become garbage during the marking cycle. Further because G1 can interleave young collections with the concurrent old collection, this restriction doesn’t apply to recently allocated objects, which can still be reclaimed quickly.
To keep the SATB invariant during concurrent marking, G1 uses a pre-write barrier (e.g. given an assignment x.a = y) executed before the assignment of the new value to save the old value like the following:
  if (marking-active) {
    if (x.a != null) {
      enqueue x.a into per-thread buffer
    }
  }

  x.a = y                  // Actual assignment
This pre-write barrier adds the previous value of x.a (if not null as there is nothing to do for null references, and many writes, like initializing writes, overwrite null values) to per-thread buffers of references to be processed. The values in these per-thread buffers are treated as roots for marking.
Section 2.5.3 of the G1 paper gives some more details about the barrier design.
Data structures in use
The result of concurrent marking is a single bitmap where, for every object that is live, the single bit corresponding to the start of the objects is set (i.e. marked). Objects may start at any location aligned to minimum object alignment, the default minimum object alignment is eight bytes (-XX:ObjectAlignmentInBytes), and one byte in the bitmap contains eight bits. So the bitmap uses around 1/64th of the Java heap (= ~1.5%).
G1 uses fingers (similar as described here) and explicit mark stacks to implement the grey set in the tri-color marking abstraction.
Because G1 uses multiple mark threads, in addition to a global finger there are per-thread local fingers. Similarly, in addition to a global mark stack there are per-thread local mark stacks.
In the tri-color marking abstraction implementation in G1, white objects are objects without a mark on the bitmap. Black objects are marked on the bitmap and to the “left” of (are located at a lower address than) the global finger and not on any of the mark stacks. An object is grey if it is marked on the bitmap and either (1) it is to the left of the global finger and on one of the mark stacks, or (2) it is to the right of (located at a higher address than) the global finger. Since at the end of marking the mark stacks are empty and the global finger at the highest address in the Java heap everything that is marked on the bitmap is black.
The use of the global finger for marking is an optimization. Newly discovered live objects only need to be pushed on the mark stacks if they are to the left of the global finger. This reduces the space used for mark stacks by roughly 50%.
To take the virtual snapshot of the Java heap at the start of marking, for every region G1 records the current value of top that denotes where the last allocation into that region ended as the top-at-mark-start (TAMS) pointer. Areas between the region’s bottom and its tams are going to be traced through, areas above need not and are not.
Concurrent Marking in G1
The Concurrent Mark Cycle comprises several steps in G1, a few of which are directly related to marking, i.e. tracing the live object graph, while others are about managing VM and GC data structures that use the marking information to prepare for subsequent garbage collections. This section will go into detail on the former, but will only briefly touch the others or only relevant parts.
Figure 7.2. of the tuning guide shows how concurrent marking is related to pauses. In the following small state diagram showing a breakdown of the phases of the concurrent cycle these are marked with (Pause):
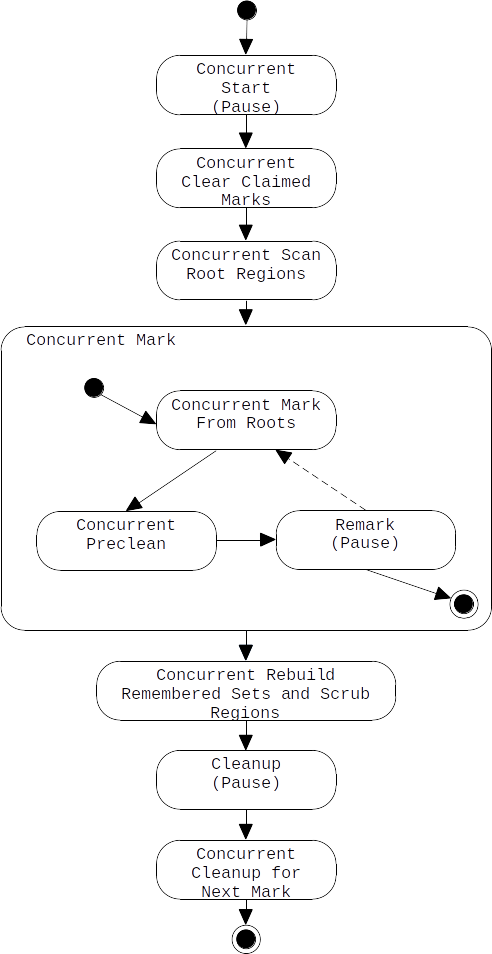
- the Concurrent Start pause that populates the mark data structures with information from the roots, starting the process.
- the Concurrent Clear Claimed Marks phase initializes garbage collection of classes and class loaders - this is simply some potentially long running work that has been pushed out from the previous pause to the concurrent phase. This post will not go into detail of that phase.
- the Concurrent Scan Root Regions phase where roots from objects from the young generation are scanned for roots into the Java heap snapshot.
- Concurrent Mark actually performs the actual tracing work, itself comprising several steps
- first, given that all roots are now marked, the Concurrent Mark From Roots phase traces through the live objects.
- the following Concurrent Preclean phase preprocesses ‘j.l.ref.References’ objects discovered (found) during concurrent mark. Here G1 can already decide for some
j.l.ref.Referenceinstances whether further processing in the following Remark pause is actually needed or not. I.e. if the referent of aj.l.ref.Referenceisnullor alive as per the previous marking, it can be removed from this list of discovered references and no further processing in the Remark pause is required. This is all of what this post will talk about this phase. - the Remark pause completes the marking and does various cleanup work like class unloading, reference processing, and initializes remembered set rebuilding. The Remark pause may in rare circumstances restart marking from the beginning of Concurrent Mark for various reasons (indicated by the dashed edge in the diagram).
- with actual marking completed, the Concurrent Rebuild Remembered Sets and Scrub Regions phase uses that marking information to create remembered set information, and prepares the heap to be cleaned of instances of previously unloaded classes that after class unloading can not be walked.
- the Cleanup pause finishes up remembered set management work and prepares for old generation garbage reclamation.
- finally, Concurrent Cleanup for Next Mark clears the bitmap to be used in the next concurrent mark cycle.
Concurrent Start pause
The Concurrent Start pause starts marking through the object graph by populating roots, i.e. locations from outside the traced Java heap into the Java heap. These are roots from VM internal data structures (like thread stacks, classes), on the other hand there are references from the young generation.
This pause is a regular young collection pause where G1 performs the following additional work:
- G1 takes the virtual snapshot: all old generation regions in the heap get their TAMS set to the current
topvalue. Young generation regions and some special regions (e.g. “Closed Archive” regions) have their TAMS set tobottom. This means they will not be traced through. - during regular root processing, roots from VM internal data structures directly mark the object on the mark bitmap.
- areas where the young collection copied objects to the survivor or old generation are recorded as Root Regions - regions as in memory ranges. These memory ranges are concurrently searched for roots into the snapshotted areas later. This avoids expensive iteration and marking of these objects during the pause.
- per-thread marking structures are reset, i.e. the local fingers set to
nulland the local mark stacks initialized. - the global finger is set to the start of the heap.
The figure below shows how a set of regions populated with objects could look before the Concurrent Start pause:
             Region 0                     Region 1                             Region N
 +-----------------------------+-----------------------------+ ... +-----------------------------+
 |AAABBBCCCCDDEEEFFFFFFFGGGGHH |                             |     |KKKKKK                       |
 +-----------------------------+-----------------------------+ ... +-----------------------------+
 ^                            ^^                                   ^      ^
 |                            |bottom == top                       |      |
 bottom                     top                                    bottom top
The pause then updates tamses and adds root regions, possibly looking like this afterwards:
             Region 0                     Region 1                             Region N
 global finger
 |                                                                        / root-region \
 v            *                                                           v             v
 +-----------------------------+-----------------------------+ ... +-----------------------------+
 |AAABBBCCCCDDEEEFFFFFFFGGGGHH |                             |     |KKKKKKRRRRRSSSTUUVVV         |
 +-----------------------------+-----------------------------+ ... +-----------------------------+
 ^                            ^^                                   ^      ^             ^
 |                            |bottom == top == tams               |      |             |
 bottom             top == tams                                    bottom tams          top
In this figure, the capital letters within the boxes indicate Java objects; region 1 has been empty before and after, so its tams had been set to bottom. The Concurrent Start pause also promoted objects R to V into old region N, which is marked as root region.
The single * above the start of the E object indicates that that object had a reference from the internal VM roots.
Concurrent Scan Root Regions
The Concurrent Start pause did not follow references from the young generation (survivors and promoted objects) into the old generation during the pause. So the Concurrent Scan Root Regions phase concurrently walks all objects in the previously recorded root regions, and marks all their references into the snapshotted areas (below tams).
In the example, the objects R to V in Region N are about to be scanned.
After Concurrent Root Region Scan more objects are marked on the bitmap, in this case H as the figure shows.
             Region 0                     Region 1                             Region N
 global finger
 |                                                                        / root-region \
 v            *             *                                             v             v
 +-----------------------------+-----------------------------+ ... +-----------------------------+
 |AAABBBCCCCDDEEEFFFFFFFGGGGHH |                             |     |KKKKKKRRRRRSSSTUUVVV         |
 +-----------------------------+-----------------------------+ ... +-----------------------------+
 ^                            ^^                                   ^      ^             ^
 |                            |bottom == top == tams               |      |             |
 bottom             top == tams                                    bottom tams          top
G1 makes sure that this concurrent phase has been completed before the next GC, at worst delaying start of the next garbage collection until completed. If G1 did not do that, there would be problems with objects not surviving that next GC wrt to SATB.
Multiple concurrent threads are used in this phase.
Concurrent Mark
The previous phases of the Concurrent Mark Cycle set up the marking, now actual marking starts with the Concurrent Mark From Roots sub-phase. It marks all live objects below tams. At the same time this phase calculates the amount of live data below it for every region.
Worker threads claim regions to scan the bitmap between that region’s bottom and tams markers for marks. A thread first atomically moves the global finger one region to the right, claiming that region. Claiming by region and advancing the global finger in region increments avoids contention on the global finger at the cost of some accuracy. This cost is low though, at most some objects will be scanned multiple times.
When scanning through the bitmap of a region, the mark thread advances its local finger from mark to mark. If the thread encounters a mark, the corresponding object’s references are examined:
- if that reference is
null, skip it.nullreferences can be ignored. - if that reference points outside the snapshotted area of a region (above a region’s
tams) it can be ignored. - otherwise try to atomically mark that referenced object:
- if that reference had already been marked, then do nothing. Already marked objects are either black (have been processed) or grey and recorded on the mark stacks if they were to the left of the global finger. Grey objects will be visited automatically when advancing the global finger or looking at the mark stack.
- if that reference had been unmarked, and that reference is to the left to the global finger, push it on the local mark stack. This is not required for referenced objects to the right of the global finger as they will be processed automatically.
The threads periodically try to reduce their local mark stack and the global SATB buffer set fed by the pre-write barrier. If there is no space left on the local mark stack, push a part of it onto the global mark stack. If the local mark stack is empty, try to get some work from the global mark stack or steal from the other task’s local mark stacks.
The algorithm terminates if both the local and global mark stacks are empty and the local and global fingers reached the end of the respective area to be scanned (i.e. the claimed region and the end of the heap). If the (bounded) global mark stack overflows, synchronize all marking threads and reset the global finger to the beginning of heap, effectively restarting the mark with all of the already visited objects implicitly greyed.
To facilitate synchronization with pending safepoints, G1 marking threads regularly polls for those based on a dynamic number of objects and words scanned metric.
After the optional Concurrent Preclean phase, G1 schedules a Remark pause.
In this pause, G1 finalizes the marking by draining all remaining SATB buffers, and walking the Java thread stacks for references once more, following the newly greyed objects until termination of the marking algorithm.
This marking finalization phase may cause the global mark stack to overflow - in that case, G1 resets the global finger and per-thread marking state and starts another Concurrent Mark round.
After finalizing the marking, the Remark pause processes j.l.ref.Reference instances, unloads classes, reclaims completely empty regions and selects old generation regions which may be evacuated later based on the amount of garbage in them. The selected regions get their remembered sets rebuilt in the following concurrent phase so that they can be evacuated in mixed collections.
The state of the region’s contents and relevant marking data structures at the start of the Remark pause may look like the following:
                                                                                          global finger
            Region 0                     Region 1                            Region N            |
                                                                                                 |
  *         * *  *          *                                                                    v
 +-----------------------------+-----------------------------+ ... +-----------------------------+
 |AAA.......DDEEEFFFFFFF....HH |ZZZZZZZZ                     |     |......RRRRRSSSTUUVVVWWWWW    |
 +-----------------------------+-----------------------------+ ... +-----------------------------+
 ^                            ^^        ^top                       ^      ^                  ^
 |                            |bottom == tams                      |      |                  |
 bottom             top == tams                                    bottom tams               top
The global finger moved to the end of the heap; some objects below tams in Region 0 and Region N were found dead indicated by .s in the figure, i.e. are garbage. Regions like Region 1 and Region N were allocated to during the marking. Although there are no marks there, as G1 allocated above tamses, they were implicitly considered live. After class unloading in this phase the garbage indicated by the .s now may contain objects that had their classes unloaded, i.e. are not parsable. This is a problem when trying to iterate over these areas during refinement or evacuating objects using remembered sets. So momentarily, every time if G1 needs to look for live objects in parts of these areas, it uses the bitmap for walking between live objects instead of just iterating over the Java heap object by object.
These “holes” will be scrubbed of these unparsable objects concurrently later, i.e. special filler objects put into their place so that that area is parsable again.
Region selection for remembered set rebuilding in the following Concurrent Rebuild Remembered Sets phase chooses regions based on liveness: if the amount of live data is less than a given percentage of the region (determined by -XX:G1MixedGCLiveThresholdPercent, default 85), that region will be selected into the candidate collection set. Given that condition is e.g. met for Region 0 and class unloading occurred, there is need for the following Concurrent Rebuild Remembered Sets and Scrub Regions phase.
For this purpose, G1 needs to scan the live data for all old generation regions allocated up to this point, searching for cross-region pointers into Region 0. First, the Remark pause takes a snapshot of the current top pointer for every region, called top-at-rebuild-start (TARS).
The figure below shows the relationship of these values:
            Region 0                     Region 1                            Region N
 +-----------------------------+-----------------------------+ ... +-----------------------------+
 |AAA.......DDEEEFFFFFFF....HH |ZZZZZZZZ                     |     |......RRRRRSSSTUUVVVWWWWW    |
 +-----------------------------+-----------------------------+ ... +-----------------------------+
 ^                            ^^        ^top == tars               ^      ^                  ^
 |                            |bottom == tams == pb                |      |                  |
 bottom             top == tams                                    bottom tams == pb         top == tars
                     == tars == pb
Note that how tams and tars are different: one indicates the top value at mark start, the other at rebuild start - meanwhile objects might have been allocated into regions. tamses are kept as they are needed during the final concurrent phase of the concurrent mark cycle.
To track the current location from which the regions are parsable (until top), for every region G1 maintains a parsable bottom (PB) pointer which is equivalent to tams at this point (and simply equal to bottom at any other time).
The reason for using a separate pointer is that tams and pb have different purposes and meaning: the former indicates up to what address there may be marks on the bitmap; the other indicates from which address on the region is parsable. While the same in the Remark pause, their values will diverge quickly.
Concurrent Rebuild Remembered Sets and Scrub Regions
During this concurrent phase the remembered sets of previously selected candidate regions are rebuilt. For every old generation region G1 needs to scan the live objects between the respective bottom and tars for cross-region references to add them to the respective remembered sets. Only after completion of this phase G1 can be sure to have collected all remembered sets for all candidate collection set regions and may evacuate them.
Modification of references within the area between bottom and tars during this scan will be caught by the post-write barrier as usual; allocation after tars during garbage collection will cause proper enqueuing of cross-region references for refinement too.
This phase will be performed by multiple threads, each claiming one of the old generation regions. Depending on where within a region, walking from one live object to the next is different:
- between
bottomandpbthere might be garbage objects for which classes have been unloaded. G1 uses the bitmap to walk from live object to live object there. - between
pbandtarsG1 can walk from object to object as all of these objects and their classes must be live.
While walking the former areas of the heap, the areas containing garbage between bottom and pb are made parsable again, i.e. G1 puts filler objects (basically integer arrays) into them and fixes up the block offset table for these objects. After a thread reaches pb, its value is immediately reset to bottom (while the mutator is still running!). This means that the entire region is then fully parsable again even before scrubbing of all regions completed.
One reason for scrubbing is that G1 only has one bitmap for the entire heap to record live objects, but the bitmap is needed again for the next marking to be completely clear. Clearing the bitmap looses information about the dead (potentially unparsable) objects, so before clearing the bitmap the Java heap needs to be fully parsable again.
The following figure shows Region 0 after it has been scrubbed sometime during this concurrent phase:
            Region 0
 +-----------------------------+
 |AAAaaaaaaaDDEEEFFFFFFFbbbbHH |
 +-----------------------------+
 ^                            ^
 |                            |
 bottom     top == tams == tars
  == pb
The garbage areas have been replaced with filler objects (indicated by lower case letters a and b), and pb reset to the bottom address of the region. Note that these filler objects are unreachable (actually, any reference to them from live objects would indicate a bug), so during evacuation they will automatically be skipped when evacuating the live objects.
Multiple threads claim regions; there is regular synchronization with safepoints to keep the time to safepoint small.
This Scrub Regions part of this phase is new to G1 with (JDK-8210708).
Cleanup pause
The Cleanup pause refines the collection set candidate list: G1 calculates an efficiency score based on occupancy and connectedness of the candidate regions, and drops those that are unlikely or too hard to collect due to efficiency concerns. This post gives more details about this mechanism.
Often, these regions that were dropped would not reclaim much space anyway, sometimes much less even than is used up by promotion, taking a lot of time to collect and even worse just lengthen the time until the next marking.
At this point G1 is ready to collect old generation regions to start the space reclamation phase. However to keep minimum mutator utilization (MMU) requirements G1 is forced to wait until another, final young-only Prepare Mixed garbage collection before starting mixed collections. The mutator phase the Cleanup pause interrupted (also observing MMU) has been sized to keep MMU using predictions for a non-mixed collection pause. Changing the type of garbage collection invalidates assumptions made during that calculation.
Concurrent Cleanup
In the Concurrent Cleanup phase G1 clears the mark bitmap in the areas it just scribbled into (between bottom and tams) and resets tamses to prepare G1 for the next concurrent marking cycle. This phase completes the concurrent marking cycle.
Traceability in the VM
The Concurrent Mark Cycle can be tracked easily using logs - -Xlog:gc,gc+marking prints the current concurrent mark cycle phases and at the end of such a phase the time the phase took. Here is output from one random log:
[441.432s][info][gc        ] GC(119) Pause Young (Concurrent Start) (G1 Evacuation Pause) 16928M->16520M(20480M) 199.167ms
[441.432s][info][gc        ] GC(120) Concurrent Mark Cycle
[441.432s][info][gc,marking] GC(120) Concurrent Clear Claimed Marks
[441.432s][info][gc,marking] GC(120) Concurrent Clear Claimed Marks 0.016ms
[441.432s][info][gc,marking] GC(120) Concurrent Scan Root Regions
[441.502s][info][gc,marking] GC(120) Concurrent Scan Root Regions 70.532ms
[441.502s][info][gc,marking] GC(120) Concurrent Mark
[441.502s][info][gc,marking] GC(120) Concurrent Mark From Roots
[443.770s][info][gc,marking] GC(120) Concurrent Mark From Roots 2267.531ms
[443.770s][info][gc,marking] GC(120) Concurrent Preclean
[443.770s][info][gc,marking] GC(120) Concurrent Preclean 0.032ms
[443.771s][info][gc,marking] GC(120) Concurrent Mark 2268.438ms
[443.771s][info][gc        ] GC(120) Pause Remark 16880M->16880M(20480M) 0.718ms
[443.771s][info][gc,marking] GC(120) Concurrent Rebuild Remembered Sets and Scrub Regions
[445.328s][info][gc,marking] GC(120) Concurrent Rebuild Remembered Sets and Scrub Regions 1556.808ms
[445.328s][info][gc        ] GC(120) Pause Cleanup 17184M->17184M(20480M) 0.383ms
[445.328s][info][gc,marking] GC(120) Concurrent Cleanup for Next Mark
[445.343s][info][gc,marking] GC(120) Concurrent Cleanup for Next Mark 15.138ms
[445.343s][info][gc        ] GC(120) Concurrent Mark Cycle 3911.573ms
This log snippet shows the phases as they are executed, in the order described in this post. There are also corresponding JFR events.
Differences to original G1
The text above explains the concurrent marking cycle and how its single bitmap is used during that time after the JDK-8210708 change in JDK 20. Previously, the concurrent cycle has been close to what is described in the G1 paper. The main difference is that original G1 maintained two marking bitmaps, with corresponding two tamses per region. One set of bitmap and tams contains the “previous” results of the marking that are used for determining liveness of objects until the “next” marking bitmap had been built completely. The Remark pause swapped these, making the “next” bitmap the “previous” bitmap, and clearing the previously “previous” bitmap for use in the next concurrent marking cycle.
So G1 always knew which objects within the regions were live using the “previous” marking. There has been no need for scrubbing the regions contents or the pb pointers.
The main disadvantage of original G1 is that native memory usage for bitmaps is double of the current mechanism: instead of 1.5% of the Java heap there has been need to keep 3% for this information. On large heaps this can be a considerable relative and absolute amount of space, particularly with the actual remembered sets now taking much less space.
Impact Discussion
The following figure shows G1 native memory usage on the BigRAMTester benchmark with the same options as in earlier postings. For reference, I added JDK 17 memory usage (dark blue). JDK 18 significantly decreased that due to remembered set data structure improvements (pink), and JDK 20 with the changes introduced in JDK-8210708 shows further significant reduction (cyan).
JDK 19 has the exact same memory usage as JDK 18 so it has been omitted here.
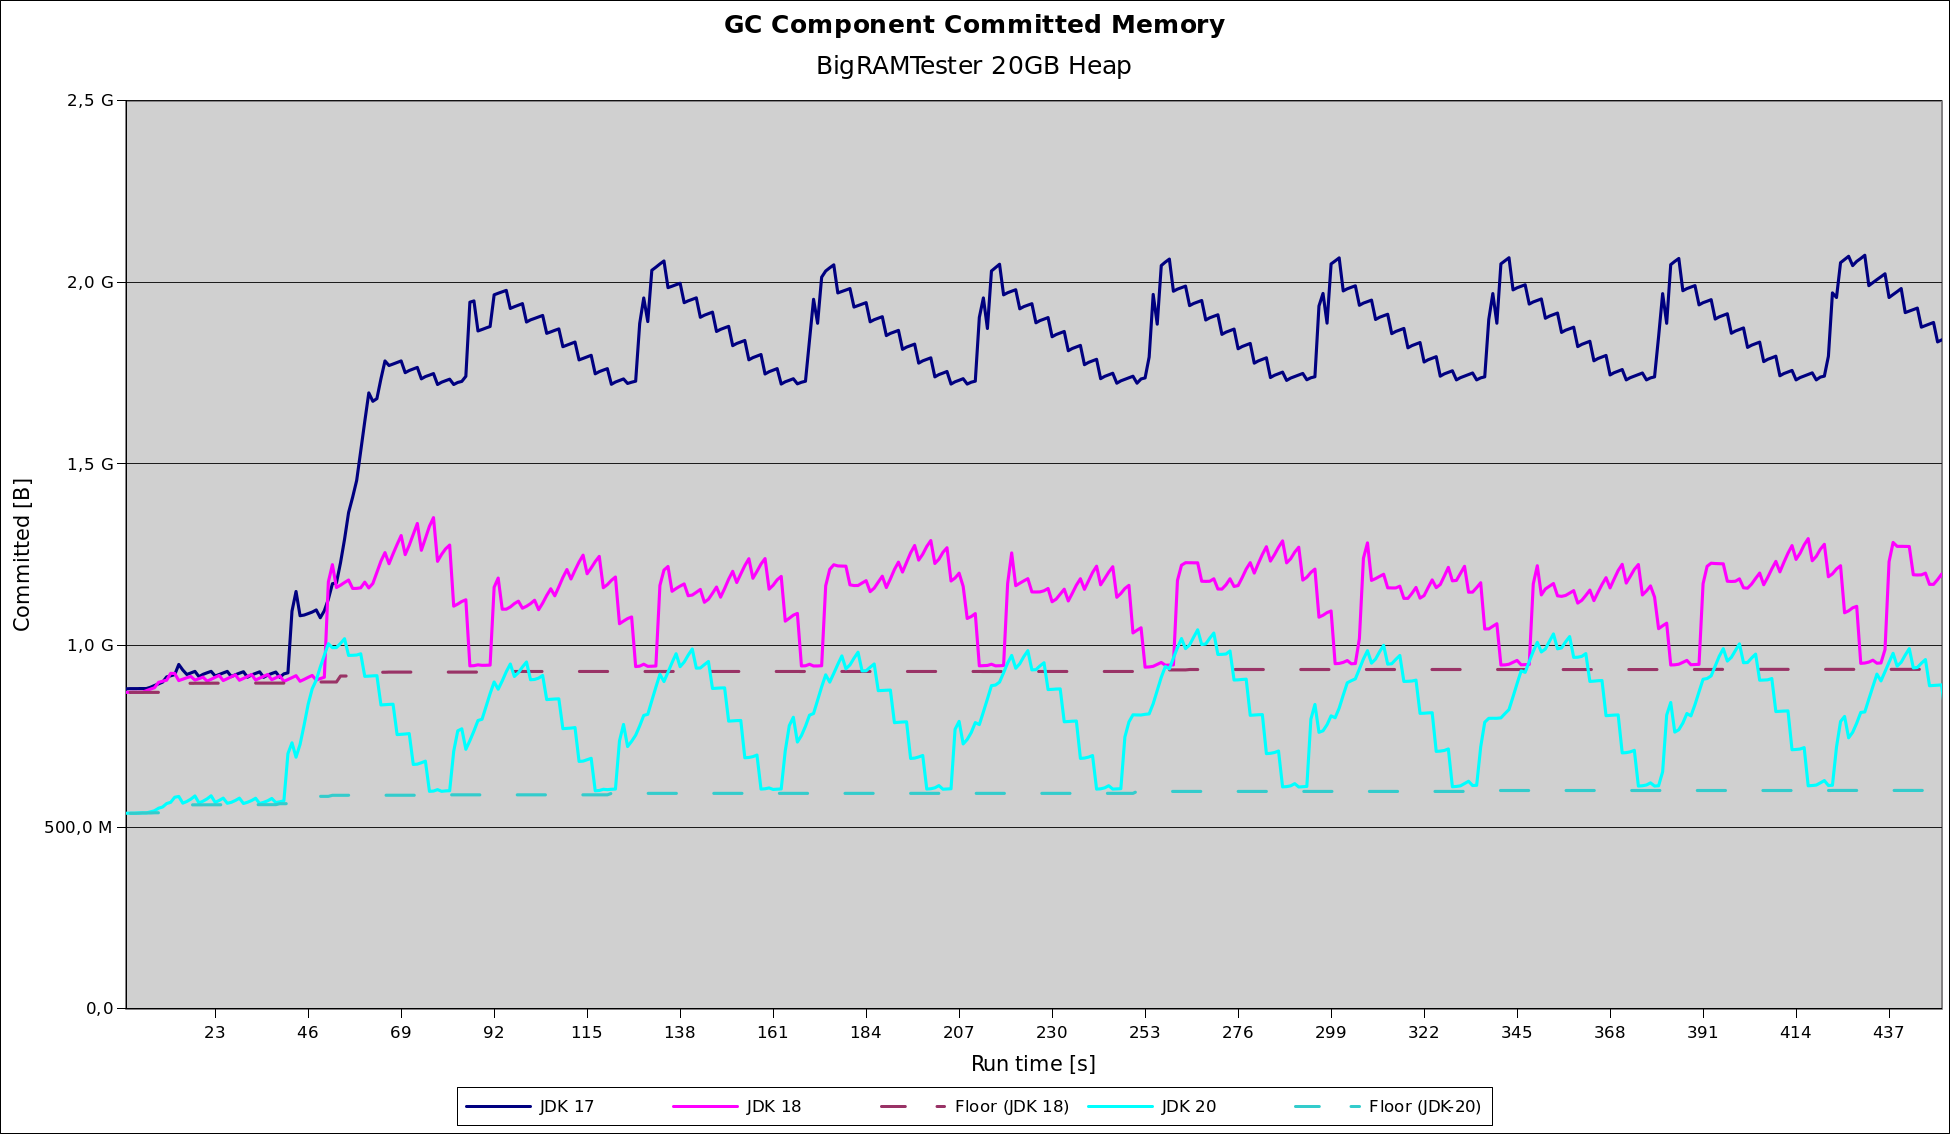
Both the JDK 18 and JDK 20 graph show the memory usage floor as dashed lines with a corresponding slightly darker hue compared to the total usage line. The improvement corresponds to the removal of the mark bitmap, dropping total G1 native memory consumption from a maximum of ~6.5% to ~5% - exactly by the suggested 1.5%. As this is a remembered set stress test, and a significant part of the native memory usage are actual remembered sets (the difference between the total memory usage and the floor) the improvements are not that large for this application.
Usually the remembered set native memory usage for applications is much smaller, so the drop in relative native memory usage would be much higher.
There are no significant differences in collection pause or concurrent mark cycle times in this benchmark before and after this change.
(Observant readers might have noticed a change in the shape of the graph and the regression in the memory usage between floor and peak of the respective graph between JDK 18 and JDK 20: this is being fixed in JDK-8292654).
Summary
Hope this helps :) Please send comments, suggestions to me, hotspot-gc-use@openjdk.java.net or hotspot-gc-dev@openjdk.java.net.
Thanks,
Thomas